
InkByte · Infographics

Infographics

Public numbers from Ofcom, the ONS, the Home Office, the CMA, DCMS, the ORR and company filings, drawn as pictures. Scroll through each story, then read the article and its sources.

Ofcom · CMA · Meta 10-K

The free lunch costs about 40 days a year. (calc.)

Search and social ring up at £0.00 at the till. The receipt underneath tells a different story, and the longest line on it is time.

(calc.) Calculated by InkByte: about 40 days a year (161 x 365 / 1440 = 40.8).

Read the story
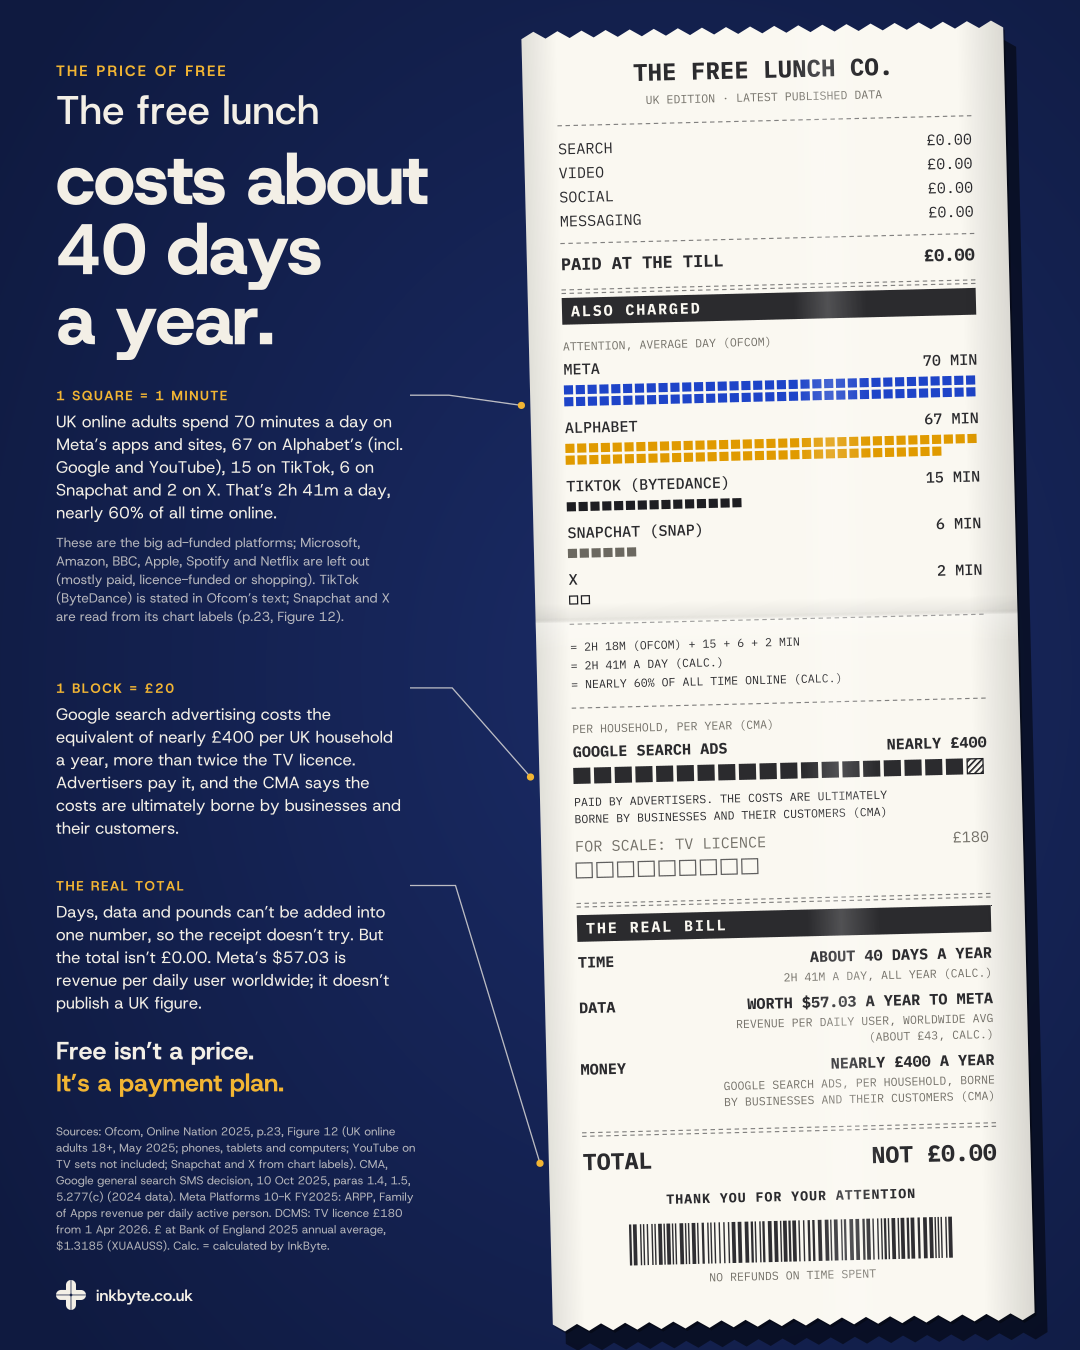
Illustration of a long paper till receipt from "The Free Lunch Co." on a dark blue background, headlined "The free lunch costs about 40 days a year." Search, video, social and messaging each cost £0.00, and paid at the till is £0.00. Under "Also charged", attention on an average day is printed as one square per minute: 70 blue for Meta, 67 amber for Alphabet, 15 black for TikTok (ByteDance), 6 grey for Snapchat and 2 outlined for X: 2h 41m a day, nearly 60% of all time online (calculated from Ofcom figures). Google search ads cost nearly £400 per household per year, shown as £20 blocks beside 9 outlined blocks for the £180 TV licence; the costs are ultimately borne by businesses and their customers (CMA). "The real bill": time, about 40 days a year; data, $57.03, Meta's average revenue per person worldwide in 2025 (Family of Apps revenue per daily active person, summed over four quarters; Meta 10-K FY2025), about £43; money, nearly £400 a year per household. Total: not £0.00. Free isn't a price. It's a payment plan.

ONS · Home Office

Fraud is now nearly half of all crime. Most of it never surfaces.

It's nearly half of all crime in England and Wales, there's more of it than there was in 2016-17, and a smaller share of it reaches the police.

Read the story
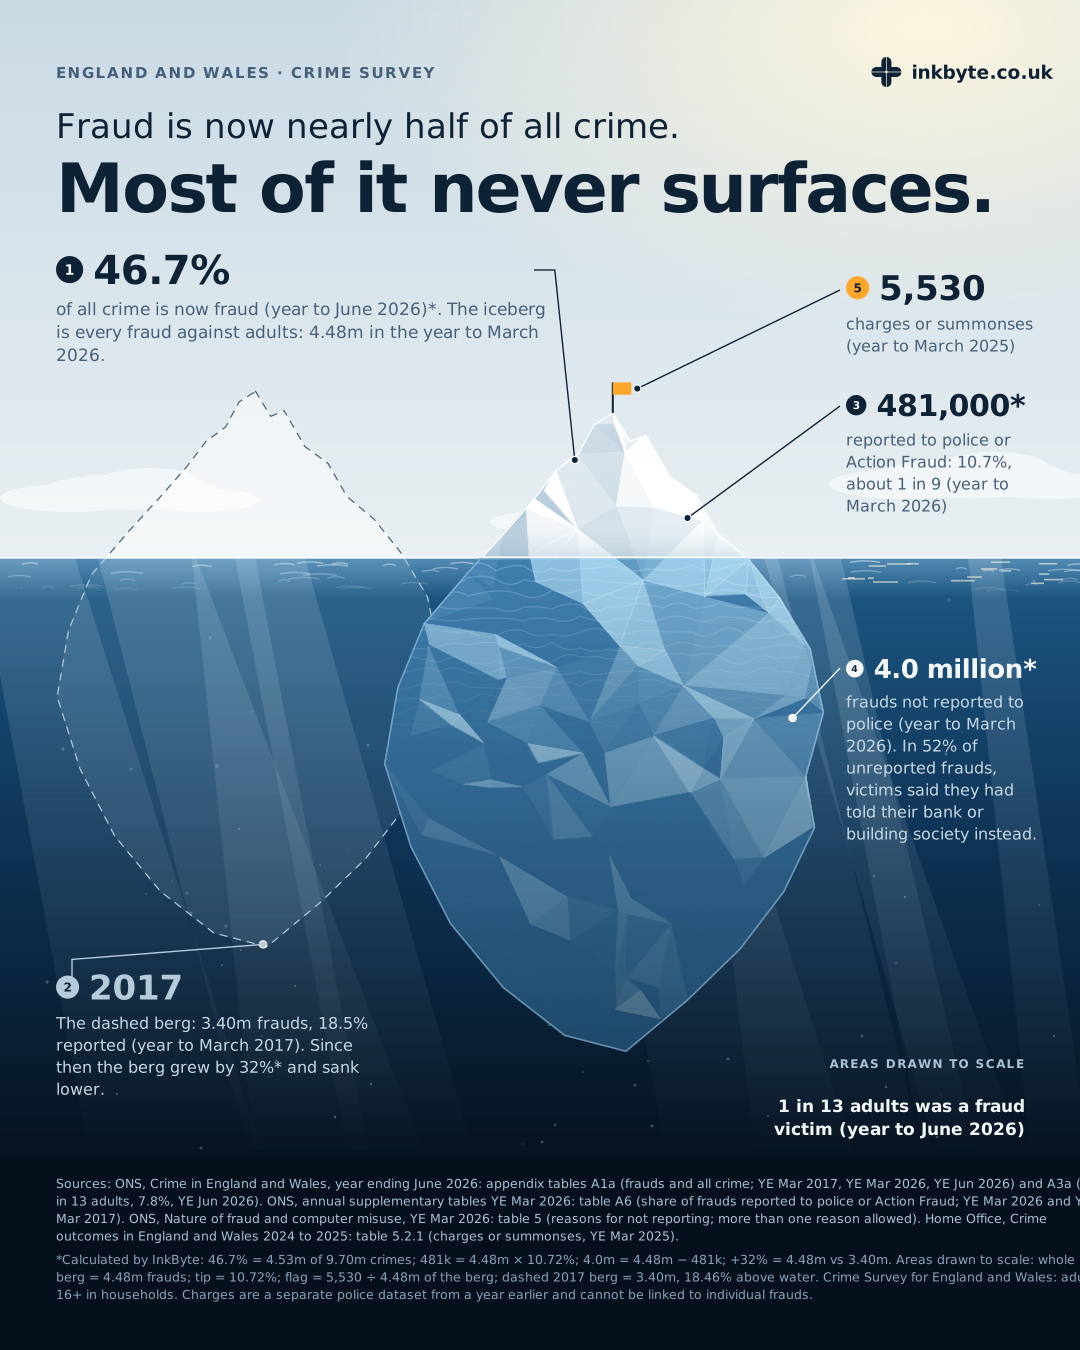
Portrait infographic. A faceted iceberg drawn to scale floats in a dark blue sea under a pale sky. Headline: 'Fraud is now nearly half of all crime. Most of it never surfaces.' The iceberg is every fraud against adults in England and Wales in the year to March 2026: 4.48 million. Numbered callouts: 1, 46.7% of all crime is now fraud (year to June 2026). 2, a smaller dashed ghost iceberg to the left shows 2017: 3.40 million frauds with 18.5% reported, sitting higher in the water; the berg has grown by 32% and sunk lower. 3, the small tip above the water is the 481,000 frauds reported to police or Action Fraud, 10.7%, about 1 in 9. 4, the 4.0 million below the water were not reported; in 52% of unreported frauds, one reason victims gave was that they'd reported it to their bank or building society. 5, a tiny orange flag on the peak is the 5,530 charges or summonses (year to March 2025). Also: 1 in 13 adults was a fraud victim (year to June 2026). Areas drawn to scale. Sources: ONS Crime Survey; Home Office. inkbyte.co.uk

Ofcom, Online Nation 2025

The 26-minute gap

UK women spend 26 minutes a day longer online than men (4h 43m vs 4h 17m).

Read the story
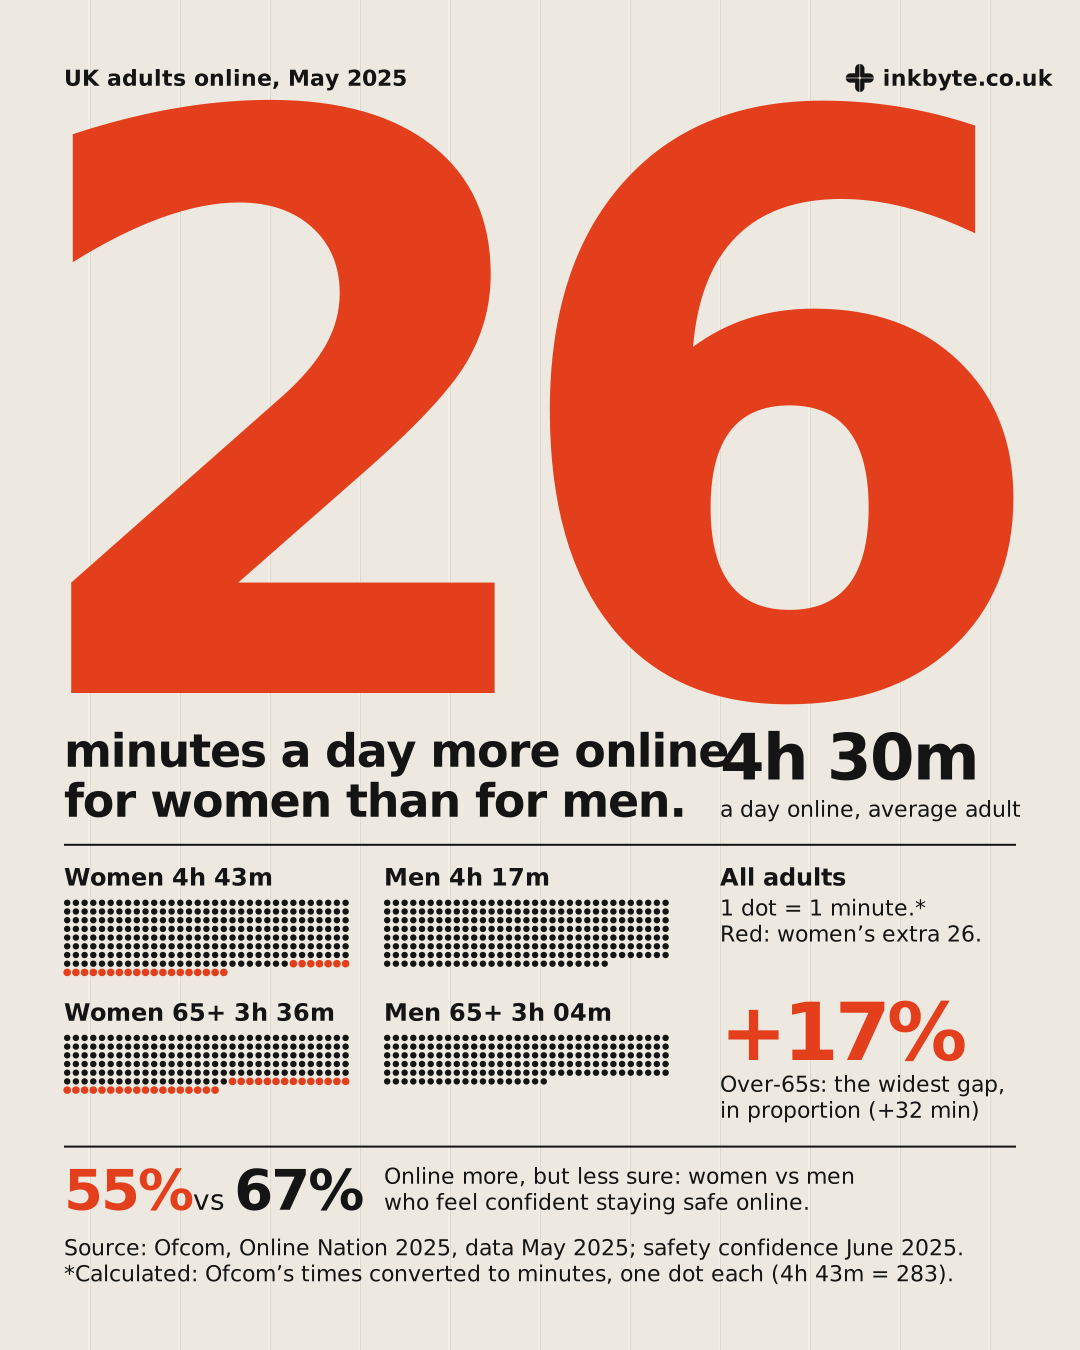
Poster dominated by a giant vermilion-red number 26, with the words ‘minutes a day more online for women than for men’. To the right: the average UK adult spends 4h 30m a day online. Below are dot charts where one dot equals one minute spent online in an average day. All adults: women 4h 43m, 283 dots, the last 26 in red; men 4h 17m, 257 black dots. Over-65s: women 3h 36m, 216 dots, the last 32 in red; men 3h 04m, 184 black dots. A red ‘+17%’ notes that over-65s have the widest gap in proportion (+32 min). At the bottom: 55% of women vs 67% of men feel confident staying safe online. Source: Ofcom, Online Nation 2025, data May 2025; safety confidence June 2025.

Wirral · DCMS · ORR

Why nobody can say how many people see the OpenAIR Gallery

Wirral is a borough of gallery-goers, and a gallery in it without a door has no published count.

Read the story
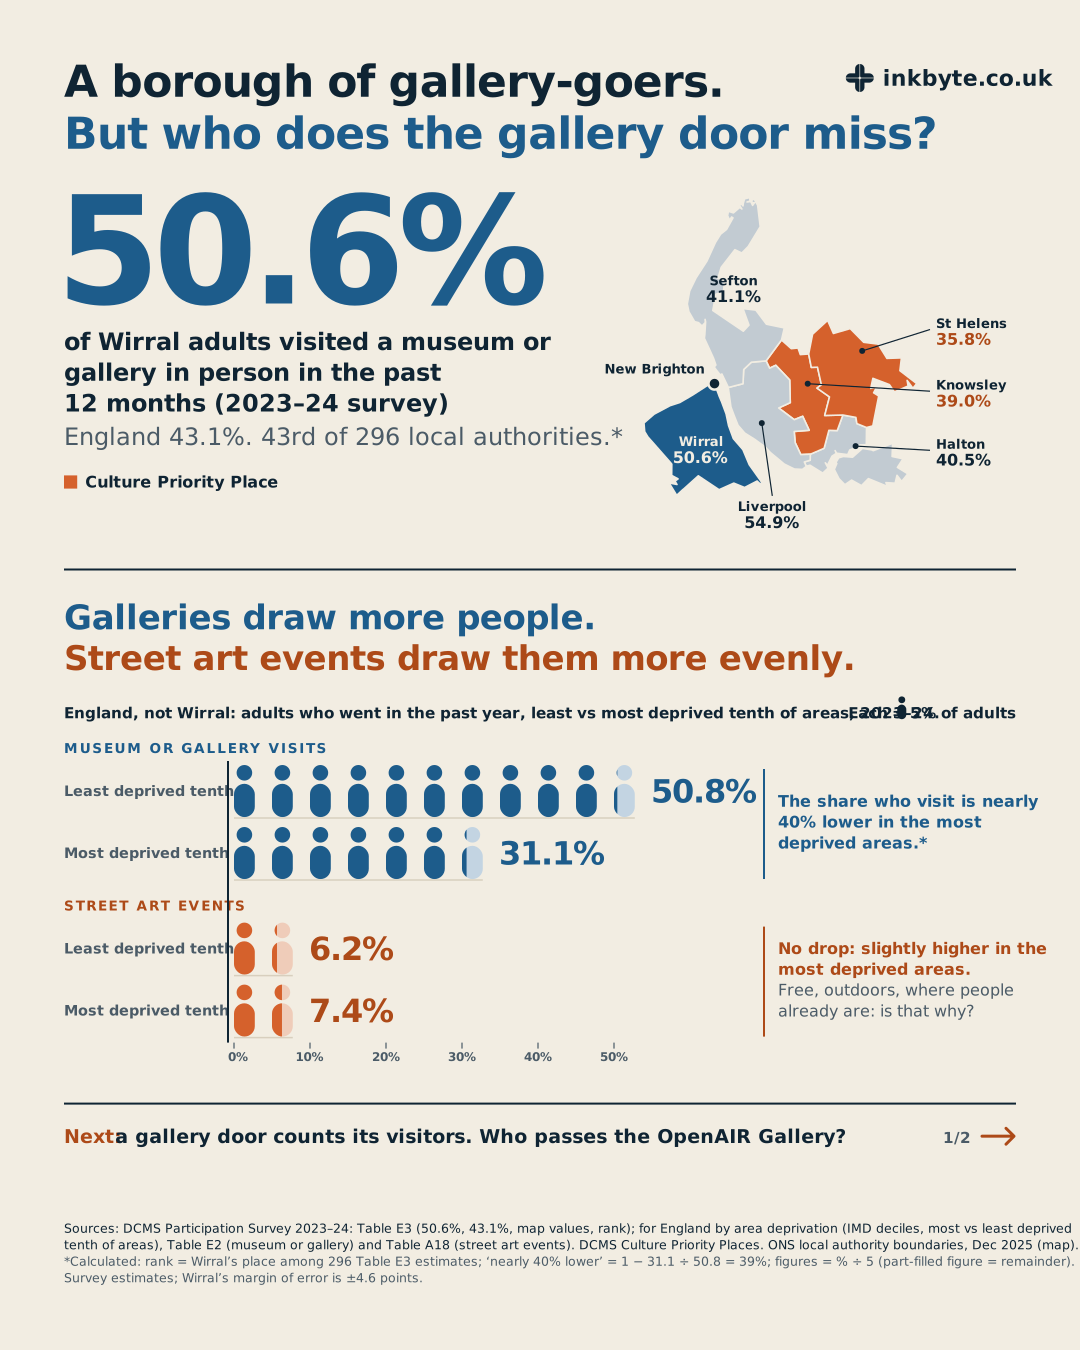
Portrait carousel slide, stacked top to bottom. Slide 1 of 2. Headline: A borough of gallery-goers. But who does the gallery door miss? Big figure: 50.6% of Wirral adults visited a museum or gallery in person in the past 12 months (2023–24 survey), against 43.1% for England; Wirral is 43rd of 296 local authorities (calculated; a survey estimate with a margin of error of plus or minus 4.6 points). A small map of the Liverpool City Region, drawn from ONS boundaries, gives the same measure for each borough: Liverpool 54.9%, Wirral 50.6%, Sefton 41.1%, Halton 40.5%, Knowsley 39.0% and St Helens 35.8%. Wirral is shaded blue with New Brighton marked at its north-east tip; Knowsley and St Helens are shaded orange as Culture Priority Places. Then: Galleries draw more people. Street art events draw them more evenly. Labelled England, not Wirral: adults who went in the past year, least vs most deprived tenth of areas, 2023–24. A pictogram chart on one shared scale from zero, each figure 5% of adults. Museum or gallery visits: least deprived tenth 50.8%, most deprived tenth 31.1%; a note says the share who visit is nearly 40% lower in the most deprived areas (calculated). Street art events: 6.2% and 7.4%; a note says no drop, slightly higher in the most deprived areas, then asks: free, outdoors, where people already are: is that why? A teaser line with an arrow: Next: a gallery door counts its visitors. Who passes the OpenAIR Gallery? 1/2. The InkByte cross logo and inkbyte.co.uk are at the top right. Sources: DCMS Participation Survey 2023–24 (Tables E3, E2, A18), DCMS Culture Priority Places and ONS boundaries.

Slide 2 of 2

A gallery door counts its visitors. An open-air gallery can’t.

The audience may be there. Nobody is counting it yet.

Read the story
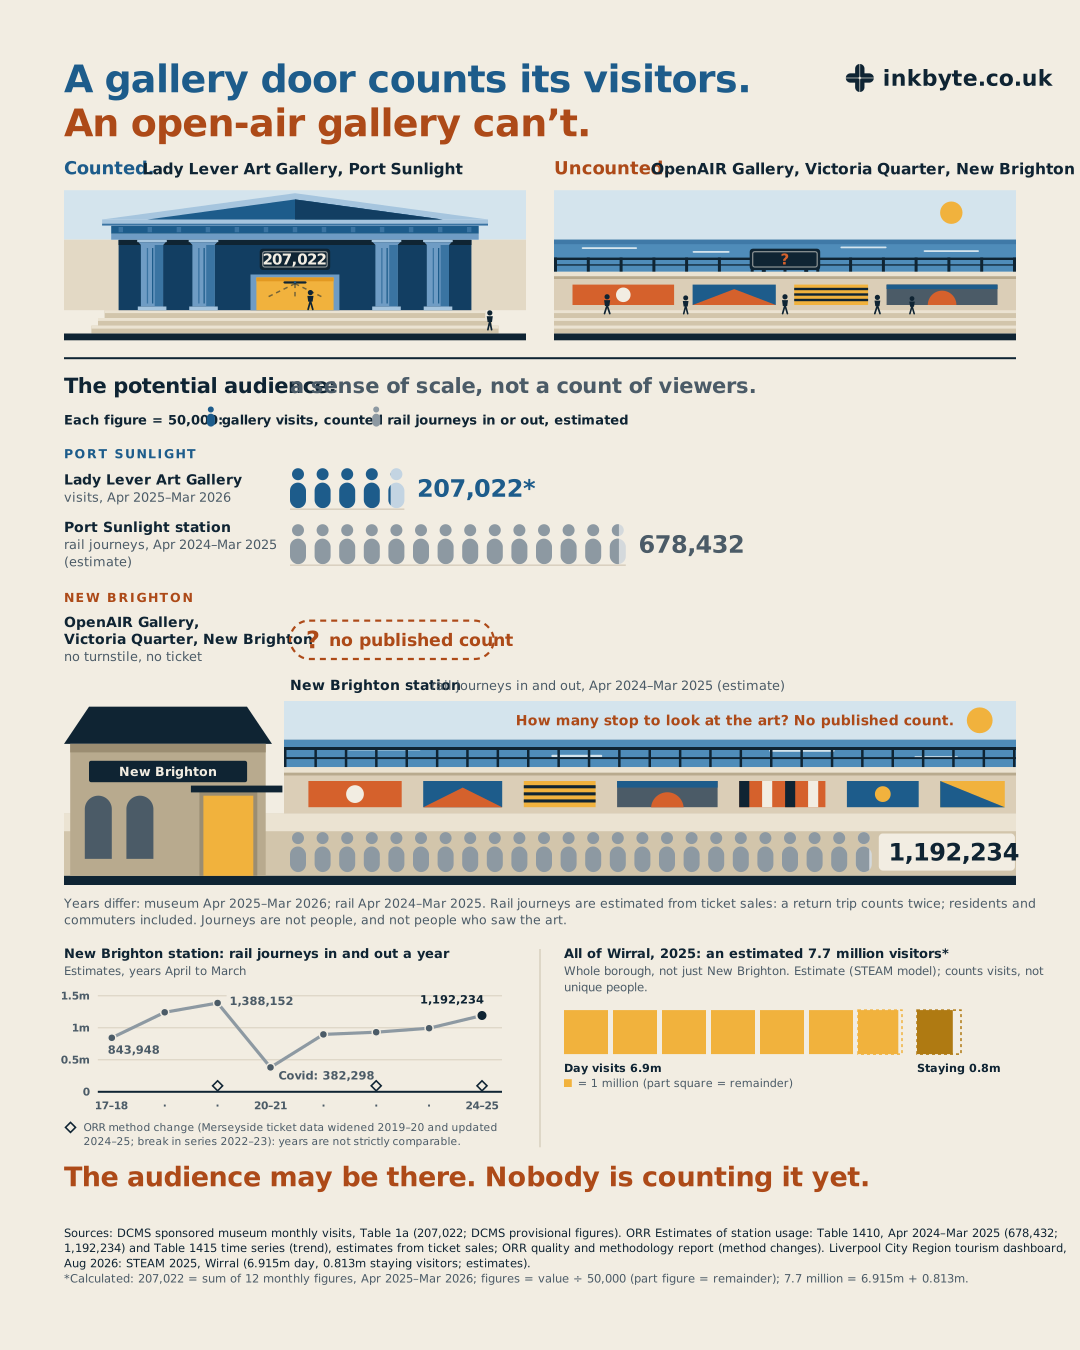
Portrait carousel slide, stacked top to bottom. Slide 2 of 2. Headline: A gallery door counts its visitors. An open-air gallery can’t. Two matching illustrated scenes side by side. Counted: Lady Lever Art Gallery, Port Sunlight, a generic classical gallery with a door counter above the open doorway and a visitor walking in freely, under a sign reading 207,022. Uncounted: OpenAIR Gallery, Victoria Quarter, New Brighton, the seafront with mural blocks on a sea wall, people strolling and a sign showing a question mark. Subheading: The potential audience: a sense of scale, not a count of viewers. An isotype chart where each figure is 50,000, with part figures for remainders: blue figures for gallery visits (counted), grey figures for rail journeys in or out (estimated). Port Sunlight: Lady Lever Art Gallery visits, April 2025 to March 2026: 207,022 (calculated from provisional figures), about 4 figures; Port Sunlight station rail journeys, April 2024 to March 2025 (estimate): 678,432, about 13.6 figures. New Brighton: OpenAIR Gallery, Victoria Quarter, New Brighton: no turnstile, no ticket: an empty dashed slot reading question mark, no published count. Then an illustrated seafront scene: New Brighton station on the left, and a row of about 24 grey figures, 1,192,234 rail journeys in and out (estimate), stretching along the promenade beneath a sea wall of mural blocks. In the sky: How many stop to look at the art? No published count. A note: years differ: museum April 2025 to March 2026; rail April 2024 to March 2025. Rail journeys are estimated from ticket sales: a return trip counts twice; residents and commuters included. Journeys are not people, and not people who saw the art. Below, side by side. A small line chart from zero: New Brighton station rail journeys in and out a year, estimates, April to March years, 2017–18 to 2024–25. It starts at 843,948, rises, drops to a Covid low of 382,298 in 2020–21, then rises to 1,192,234; the 2019–20 peak of 1,388,152 is labelled. Diamonds on the axis mark ORR method changes in 2019–20, 2022–23 and 2024–25 (Merseyside ticket data widened, a break in series, then updated): years are not strictly comparable. A scale of squares, each 1 million: All of Wirral, 2025: an estimated 7.7 million visitors (calculated), whole borough, not just New Brighton; STEAM model estimate counting visits, not unique people. About 6.9 squares of day visits and 0.8 of a square of staying visitors. Closing line: The audience may be there. Nobody is counting it yet. The InkByte cross logo and inkbyte.co.uk are at the top right. Sources: DCMS sponsored museum monthly visits (Table 1a, provisional), ORR Estimates of station usage (Tables 1410 and 1415) and quality and methodology report, Liverpool City Region tourism dashboard (STEAM 2025).

Also from InkByte

Client Brand Brain turns a brand's voice into a reusable AI pack: a PDF voice guide plus a ready system prompt. See Client Brand Brain at brandbrain.inkbyte.co.uk