 INKBYTE
Wirral · DCMS · ORR
Why nobody can say how many people see the OpenAIR Gallery
Wirral is a borough of gallery-goers, and a gallery in it without a door has no published count.
A gallery with a front door can tell you how many people came through it last year, and a gallery painted on the walls of a town can't.
I spent about twenty years running social media for global brands, which is a line of work where nearly everything gets counted, a good deal of it for no particular reason. So I find it a bit rich that the one audience I'd actually like a number for is the one nobody has ever measured. I'm the Founder and Creative Director of New Brighton Creative Futures CIC, the small not-for-profit behind the OpenAIR Gallery in New Brighton, which has no front door or ticket desk, so there's no tally of who comes to look.
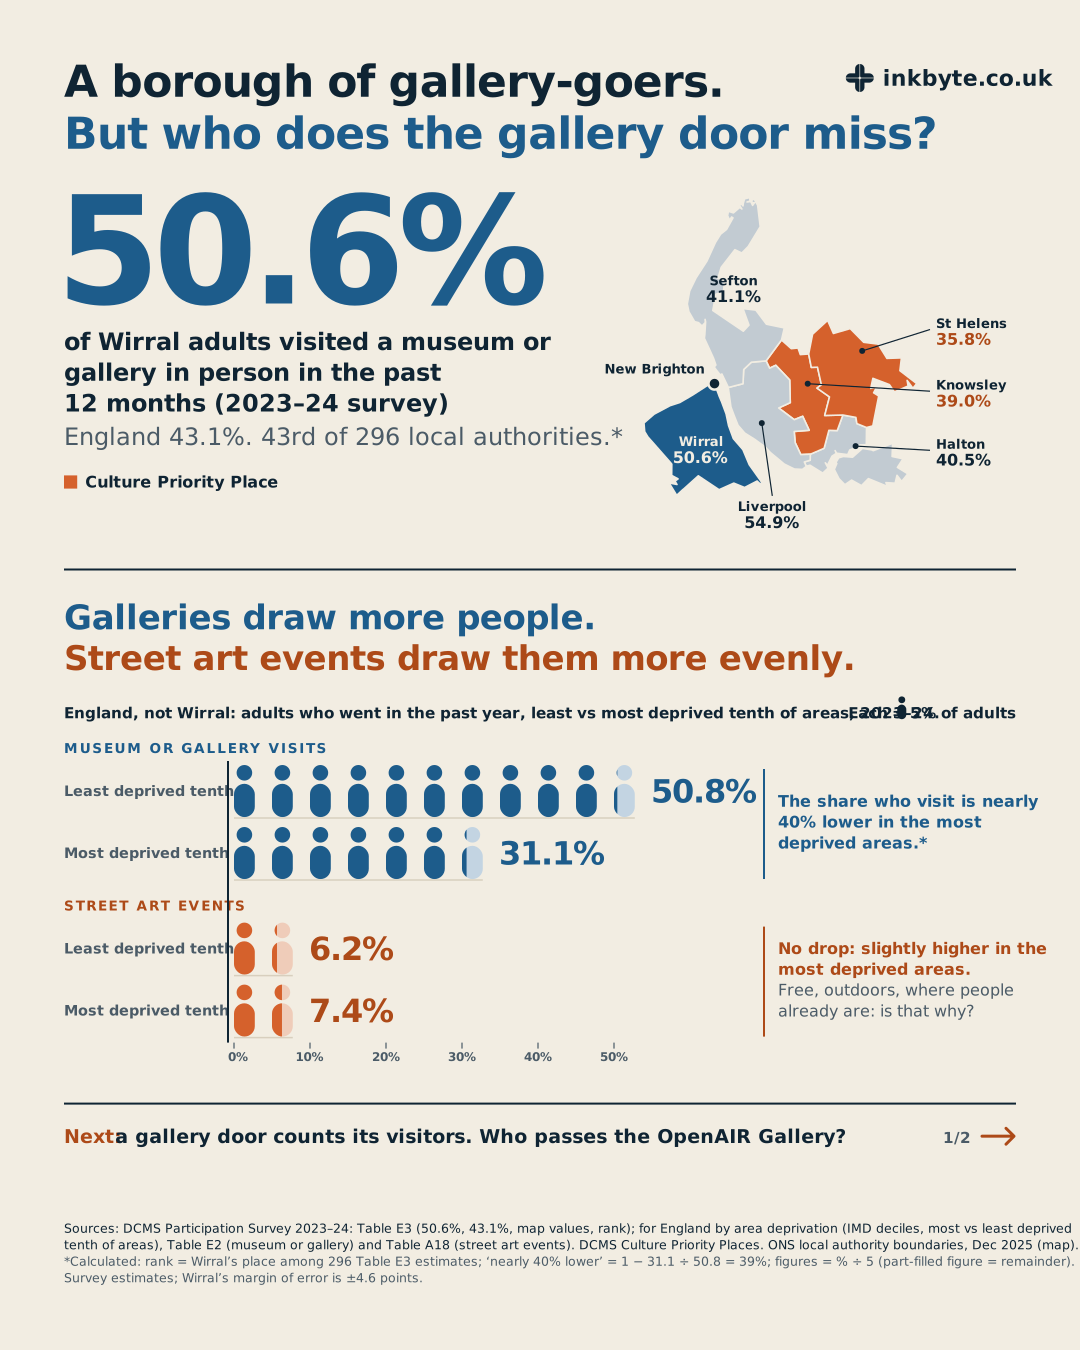
Wirral, as it happens, likes a gallery more than most places. In the 2023–24 national Participation Survey, 50.6% of Wirral adults said they'd been to a museum or gallery in person in the past 12 months, against 43.1% across England. By my working that puts Wirral 43rd of 296 local authorities, although the ranking is calculated from the published tables rather than published itself, and because the figure is a survey estimate it could be out by 4.6 points either way. Within the Liverpool City Region only Liverpool comes out ahead on the headline figure, at 54.9%, though the two estimates overlap. Knowsley is on 39.0% and St Helens on 35.8%, and both are on the government's list of Culture Priority Places, which Wirral isn't. The list also weighs deprivation and need, not attendance alone, and a borough average is a blunt instrument and says nothing about who stayed at home.
The survey doesn't break that down for Wirral, so the next figures are for England as a whole. In the least deprived tenth of areas, 50.8% of adults had been to a museum or gallery in the past year, while in the most deprived tenth it was 31.1%, which works out at nearly 40% lower. The same survey asks about street art events, and there the split goes slightly the other way, with 6.2% in the least deprived areas and 7.4% in the most deprived, a fraction higher. These are much smaller numbers, I should say. Far more people go to galleries than to street art events, and nothing in the survey says street art draws a bigger crowd than galleries do. What caught my eye is that the gallery audience thins out in poorer areas and the street art audience doesn't. The survey doesn't say why, and I'm not going to supply a reason it doesn't give, but if your job is reaching the people culture usually misses, I'd want to know more about that pattern.
Over in Port Sunlight, the Lady Lever Art Gallery is free to walk into and still counts every visit through its door. Add up its provisional monthly figures for April 2025 to March 2026 and you get 207,022 visits (our calculation). That total counts visits rather than people, so a regular who pops in every month is in there twelve times. The OpenAIR Gallery has no turnstile and no ticket. You walk along a street in the Victoria Quarter and either stop at a wall or carry on, which is rather the point, and it means there's no published count of its audience at all. When a funder asks how many people see the work, and funders are quite right to ask, the truthful answer is that nobody has measured it.
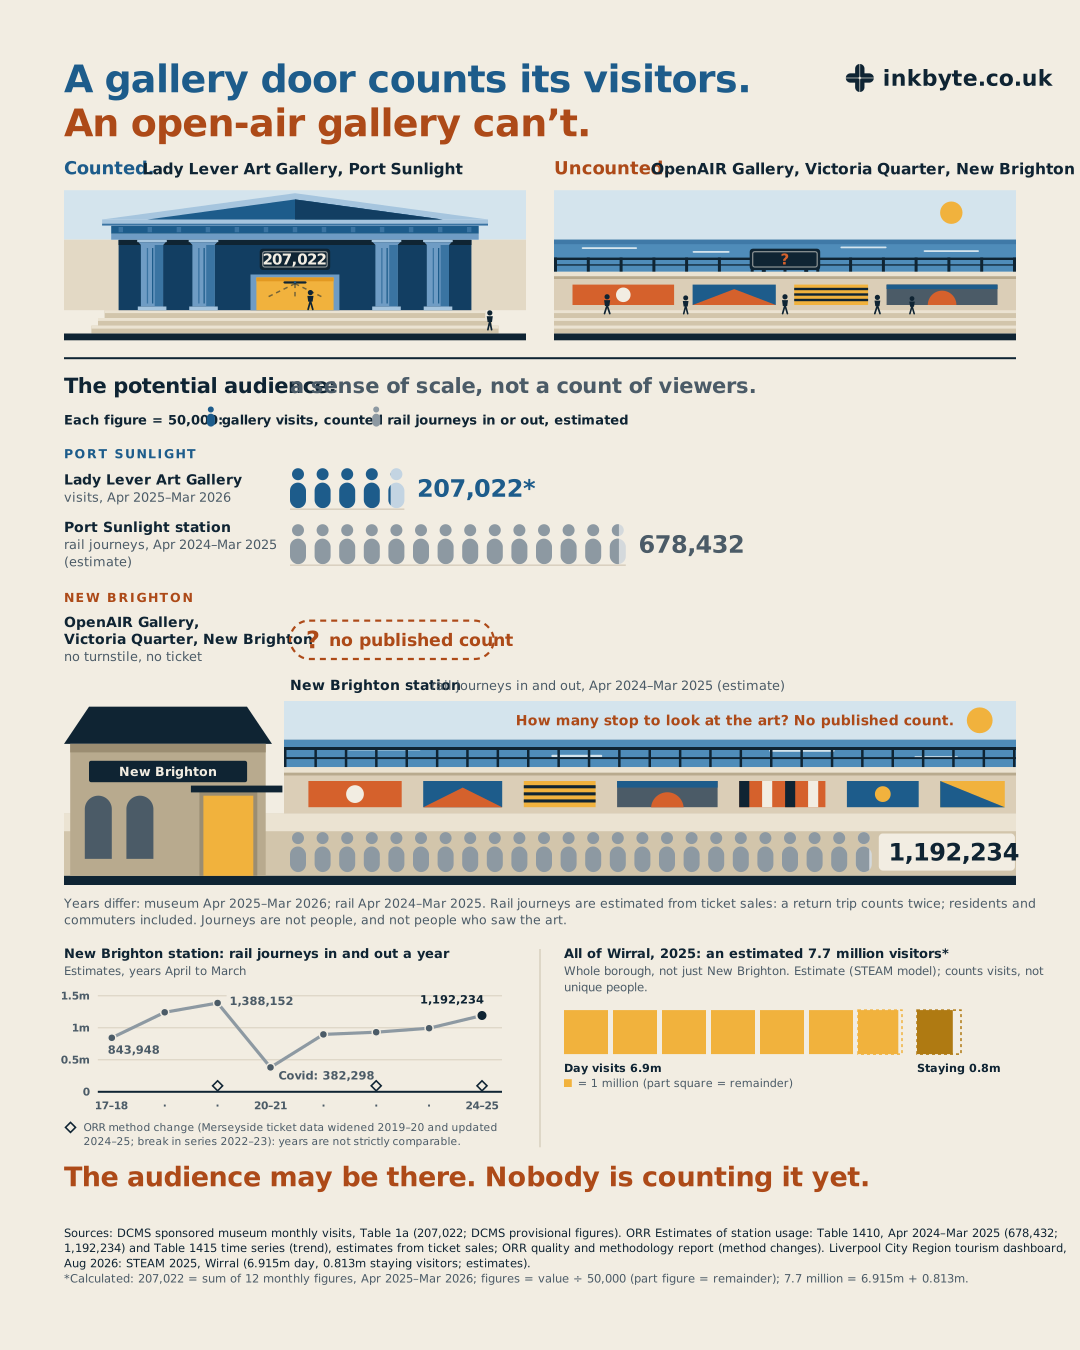
The nearest thing we have is the railway. New Brighton station sits at the top of the hill, with the Victoria Quarter on the way down to the sea, and the Office of Rail and Road estimates that 1,192,234 journeys started or ended there in 2024–25, compared with 678,432 at Port Sunlight, the station near the Lady Lever. They need careful handling, because they count journeys rather than people, so a return trip counts twice, and they include residents and commuters, plenty of whom are on their way to work rather than coming to look at a wall. They're also estimated from ticket sales rather than counted at the barrier.
The longer run goes from 843,948 journeys in 2017–18 up to a peak of 1,388,152 in 2019–20, down to a Covid low of 382,298 and back up since. ORR has changed its method along the way, widening the Merseyside ticket data in 2019–20, with a break in the series in 2022–23 and a further update for 2024–25, so the years aren't strictly comparable and I wouldn't hang an argument on which way the line is going. The museum and rail years don't match either, 2025–26 against 2024–25, and I've only put them side by side for a sense of scale. The STEAM tourism model estimates Wirral drew 7.7 million visitors in 2025, but that covers the whole borough rather than New Brighton, and it counts visits rather than individual people. None of these is a count of anyone looking at a mural.
That gap is the case I'd put to anyone who funds culture round here. A proper count, done the same way every year, of how many people walk the OpenAIR Gallery and when, would sit alongside the gallery door figures and the station estimates and settle the question one way or the other. It might show that a lot of people stop at these walls and nobody has written it down, or it might show they don't, and we'd want to know that as well. That England pattern keeps nagging at me, because if street art events really do hold on to their audience in poorer areas, an open-air gallery in a borough that already likes its galleries might reach people who don't show up in gallery counts. Nothing here proves that. The audience may be there. Nobody is counting it yet.
Rory
Rory Wilmer is the founder and director of InkByte.